
Each week during the wildfire season, Dr. Mike Flannigan will share a five- to 10-day fire weather outlook for Canada. This is a first step in developing a national early warning system for wildfire in Canada. The fire weather outlook will be posted every Tuesday.
Mike Flannigan is the scientific director of the Institute for Wildfire Science, Adaptation, and Resiliency as well as the BC Innovation Research Chair in Predictive Services, Emergency Management and Fire Science at Thompson Rivers University.
View bioWeekly Outlook | Sept 19-24, 2026 Issued September 15, 2026
All information provided below is reported at the time of publication and may not reflect more recent updates.
Note, this is the last scheduled fire weather outlook for 2026. Thanks for all your questions and comments- they are welcomed and greatly appreciated. We plan to continue the fire weather outlook in 2027 and welcome suggestions.
If there is a significant fire weather development this Autumn or Winter, we will issue a special fire weather outlook.
Current fire situationThe end of the fire season as we know it?
The fire situation continues to be quiet across the country. There are still 323 out of control fires (Figure 1) though most of these are monitored out of control fires (276 – purple circles in Figure 2). The 2026 area burned in Canada thus far is around 4.5 million hectares but more significant are the impacts, loss of life, homes/structures lost, evacuations and the smoke. Figure 2 shows the location and status of fires across Canada and most of the monitored out of control fires are in the Northwest Territories.
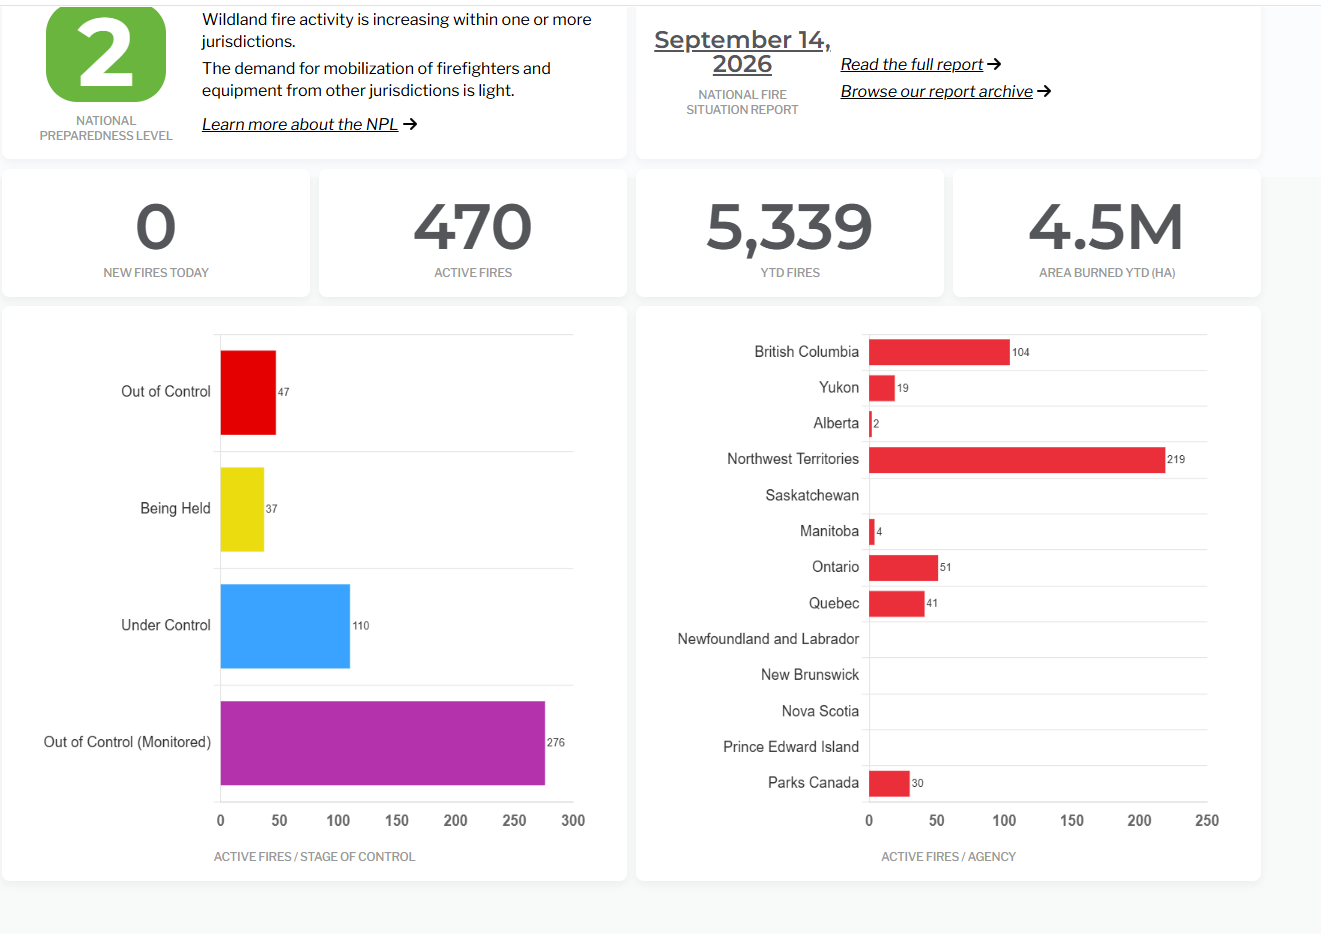 Figure 1. Canadian fire summary. ciffc.net
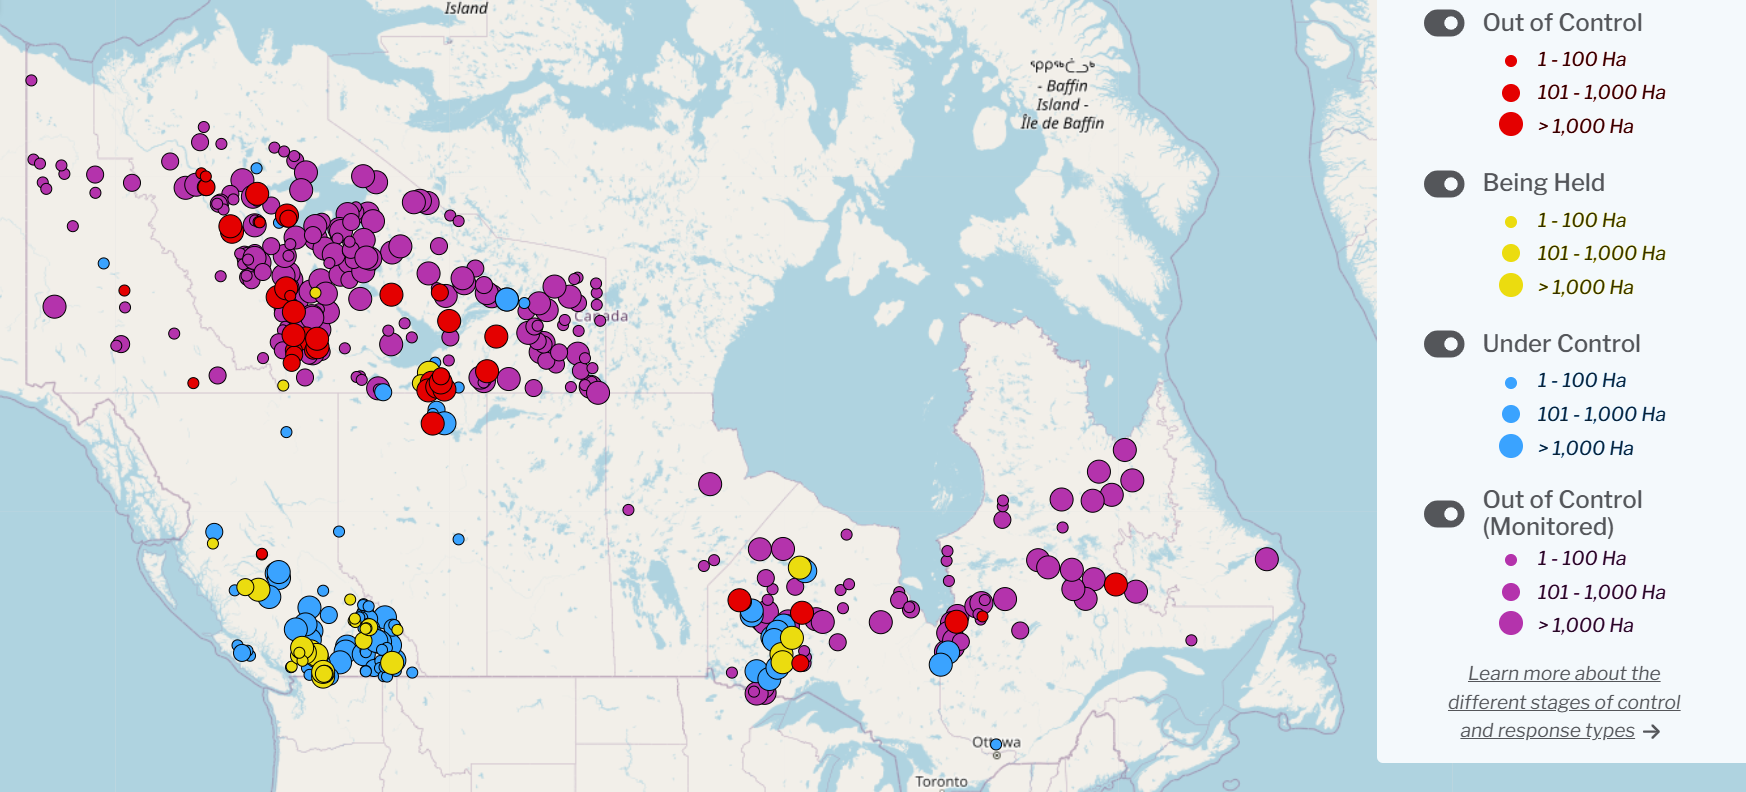 Figure 2. Location and status of fires across Canada ciffc.net
Fire weather outlook September 19-24, 2026
The quiet fire weather trend continues as we continue to see a progression of high and low/troughs at the surface and the upper air moving from west to east across Canada. This means that most of Canada experiences a few nice warm days followed by cooler weather with showers/rain. This pattern is not conducive for fire activity. The updated drought map for August 31,2026 (Figure 3) shows areas of abnormally dry and drought conditions across Canada. If we see an extended period of warm/mild and dry conditions the areas to watch include the NWT, southern BC, northern ON, northern QC and Labrador as well as parts of central northern SK (see A look ahead section).
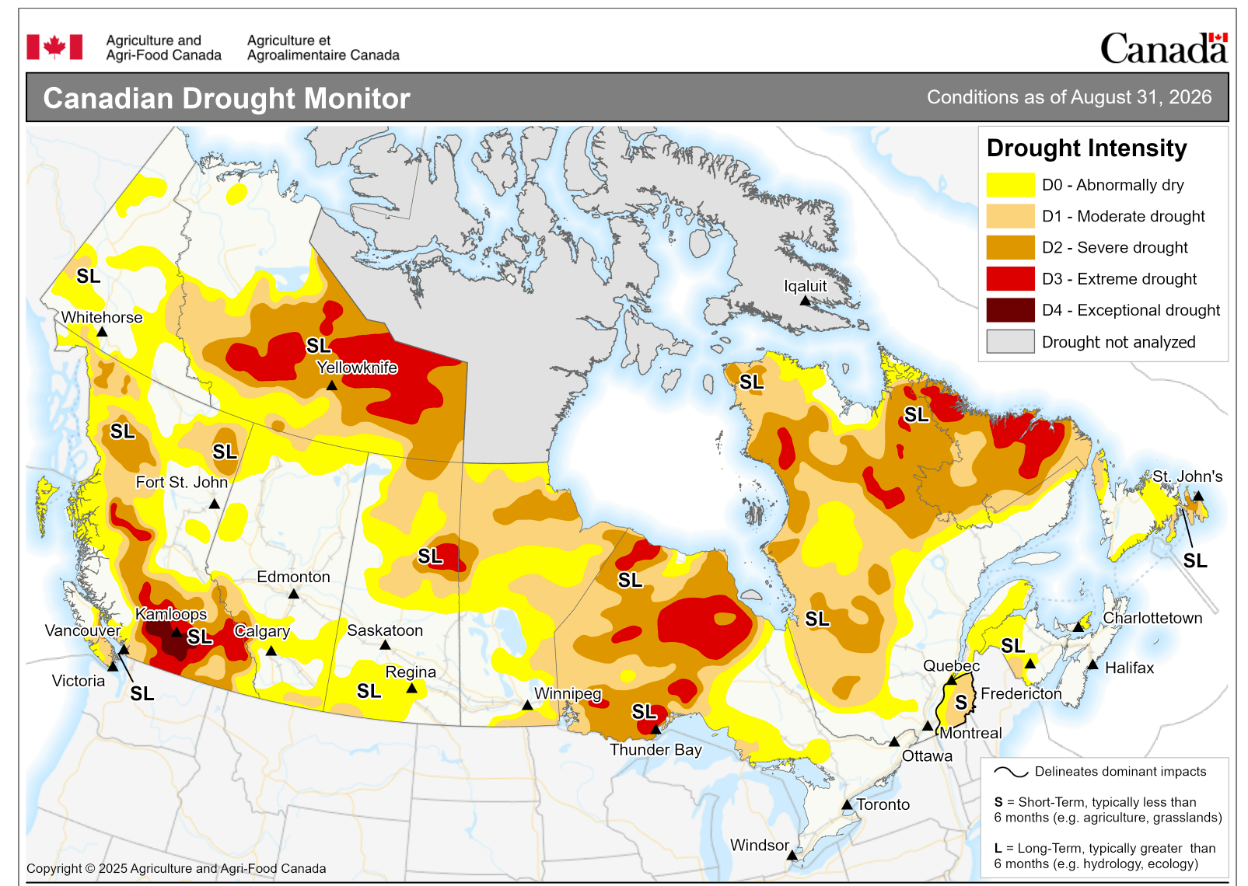 Figure 3. Canadian Drought Monitor showing abnormally dry and drought conditions across Canada 31 August 2026.Current drought conditions - agriculture.canada.ca
A look ahead
The updated C3S multi-system forecasts are available. October forecast is likely to be milder than normal across all of Canada and likely to be drier than normal for a lot of southern Canada (Figures 4 and 5). The multi-system seasonal forecast for October – December (OND), November- January (NDJ) and December-February (DJF) are also available. The forecasts for October- December continue the trend of above normal temperatures for all of Canada with less than normal precipitation likely for much of southern Canada (Figures 6 and 7).
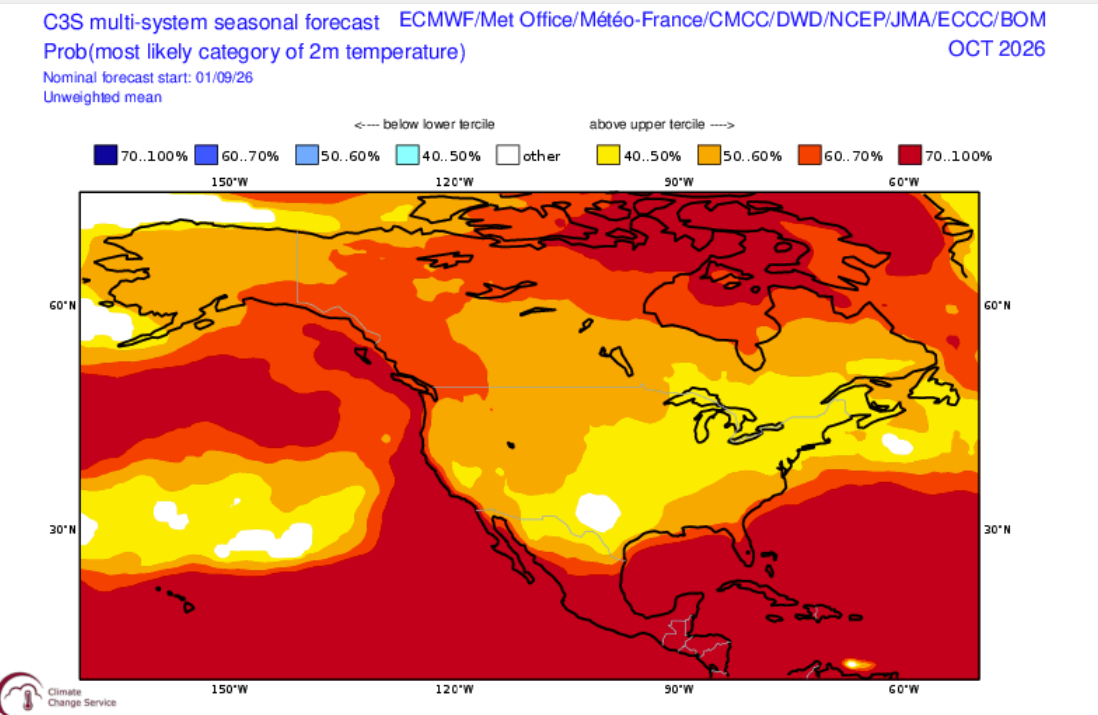 Figure 4. C3S October 2m temperature anomaly outlook. ECMWF | Charts
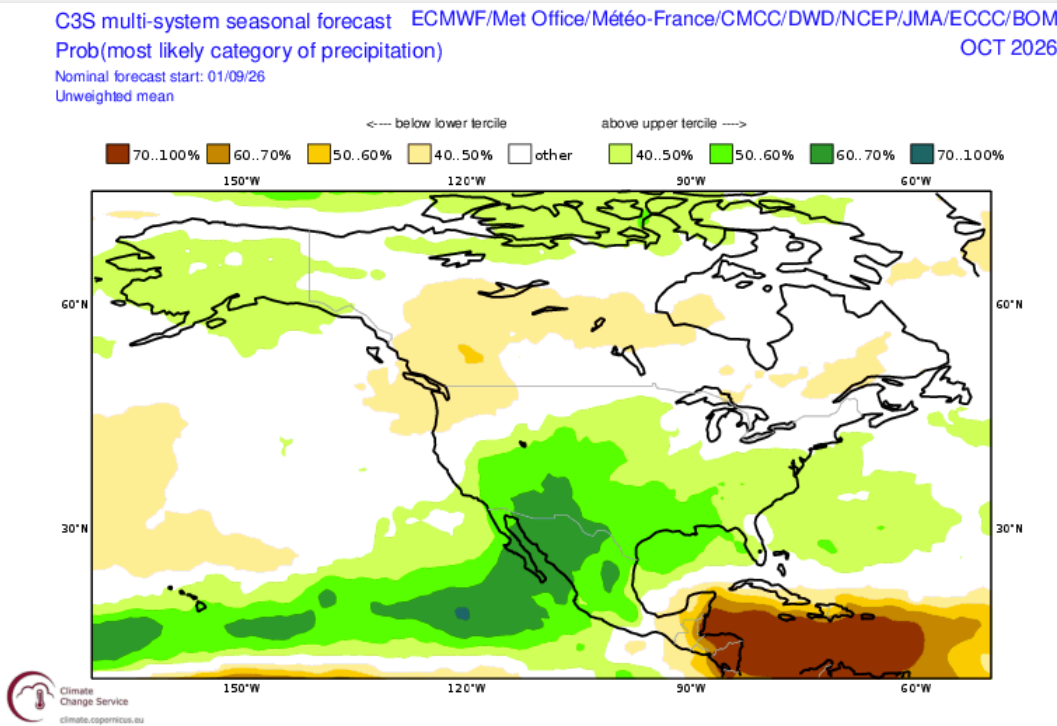 Figure 5. C3S October – December precipitation anomaly outlook. ECMWF | Charts
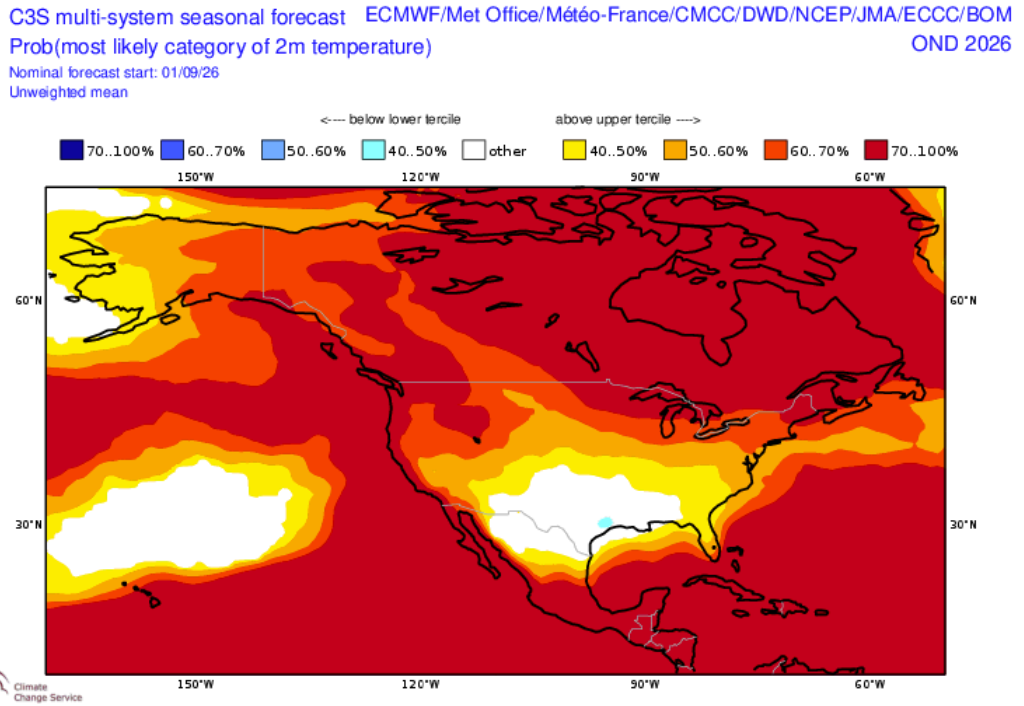 Figure 6. C3S October – December 2m temperature anomaly outlook. ECMWF | Charts
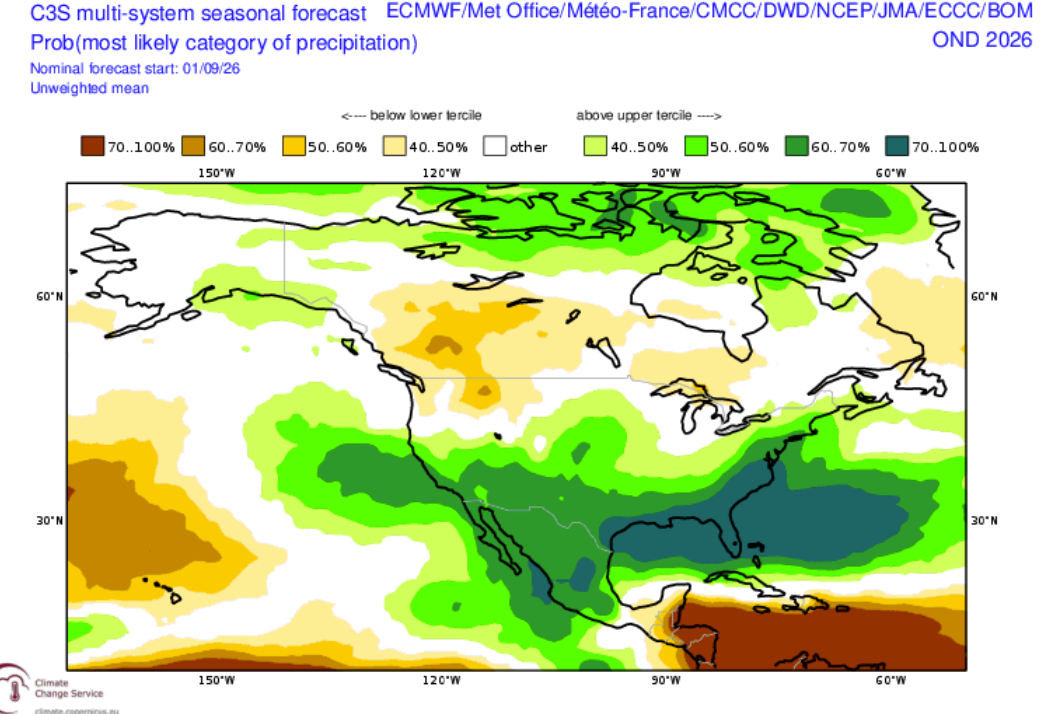 Figure 7. C3S October – December precipitation anomaly outlook. ECMWF | Charts
Environment Climate Change Canada (ECCC) recently released the second edition of Canada’s Changing Climate Report (CCCR2026) - a scientific assessment of past and future changes in Canada’s climate (Canada’s Changing Climate Report 2026 - Canada.ca )
It provides an update to the first edition of Canada’s Changing Climate Report (CCCR2019).
This is a sobering report. A few headline statements below.
Canada’s Changing Climate Report 2026Headline statement 2: Canada has warmed rapidly over the past 50 years, consistent with rapid global warming. Since 1970, Canada has warmed nearly twice as fast as the global average, and the Canadian Arctic has warmed three times as fast as the global average.
Headline statement 10: More frequent and intense extreme fire weather is projected for most regions of Canada. Fire seasons are already longer and will lengthen further with additional global warming.
For Canada, a warmer world means more conducive fire weather. As we continue to warm, we expect longer fire seasons and with the higher temperatures we expect increased vapour pressure deficits that will dry out dead fuels more rapidly making it easier for fires to start and spread. Overall, we have seen and expect an increase in precipitation in Canada, but a study suggests that the increase in precipitation will not compensate for the increased fuel dryness due warmer temperatures. link.springer.com.
Useful Websites Fire and weather site
This week I will suggest a website for fire and fire weather information in Canada from the Canadian Forest Service. The Canadian Fire Weather Information System site was redesigned this year and has lots of information on fires, fire weather and fire climate (Canadian Wildland Fire Information System). The current situation is covered in detail as well as the fire weather situation and the fire weather and fire season forecasts. Check the website out when you have a chance.
Weekly forecast history
August 2026
July 2026
Questions?We have the answers
Questions, including media requests for Mike Flannigan, can be emailed to wildfire@tru.ca.
Want to keep up with fire weather and fire activity? Check out @mikeflannigan.bsky.social.
Subscribe to the Canada fire weather outlook